- Bitcoin’s price follows a high-timeframe bullish Cypher pattern, with the CD leg currently in a steep decline phase.
- The Cypher pattern suggests a potential support zone at the 0.786 Fibonacci retracement of the XA leg, signaling a possible reversal.
- Market conditions indicate strong bearish momentum, making Fibonacci retracement levels crucial for assessing potential bullish setups.
Bitcoin’s price structure has formed a high-time frame (HTF) bullish Cypher harmonic pattern, a technical indicator used by traders to assess market movements. While this pattern historically signals potential upside, the current market positioning suggests that Bitcoin may be in the midst of a steep decline on the CD leg.

Bitcoin’s Current Price Structure
Toblerone analysis displays Bitcoin’s price action with key Elliott Wave structures and Fibonacci retracement levels. It shows an upward trend from 2023, marked by wave structures X, A, B, C, and D. Fibonacci ratios 0.347, 0.701, 1.18, and 1.609 align with trend reversals. The current price of $95,971 reflects a correction phase, indicating potential continuation toward $110,000.
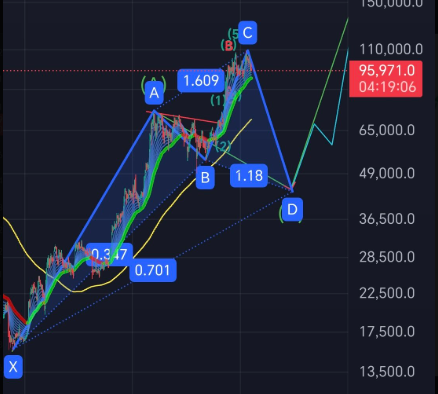
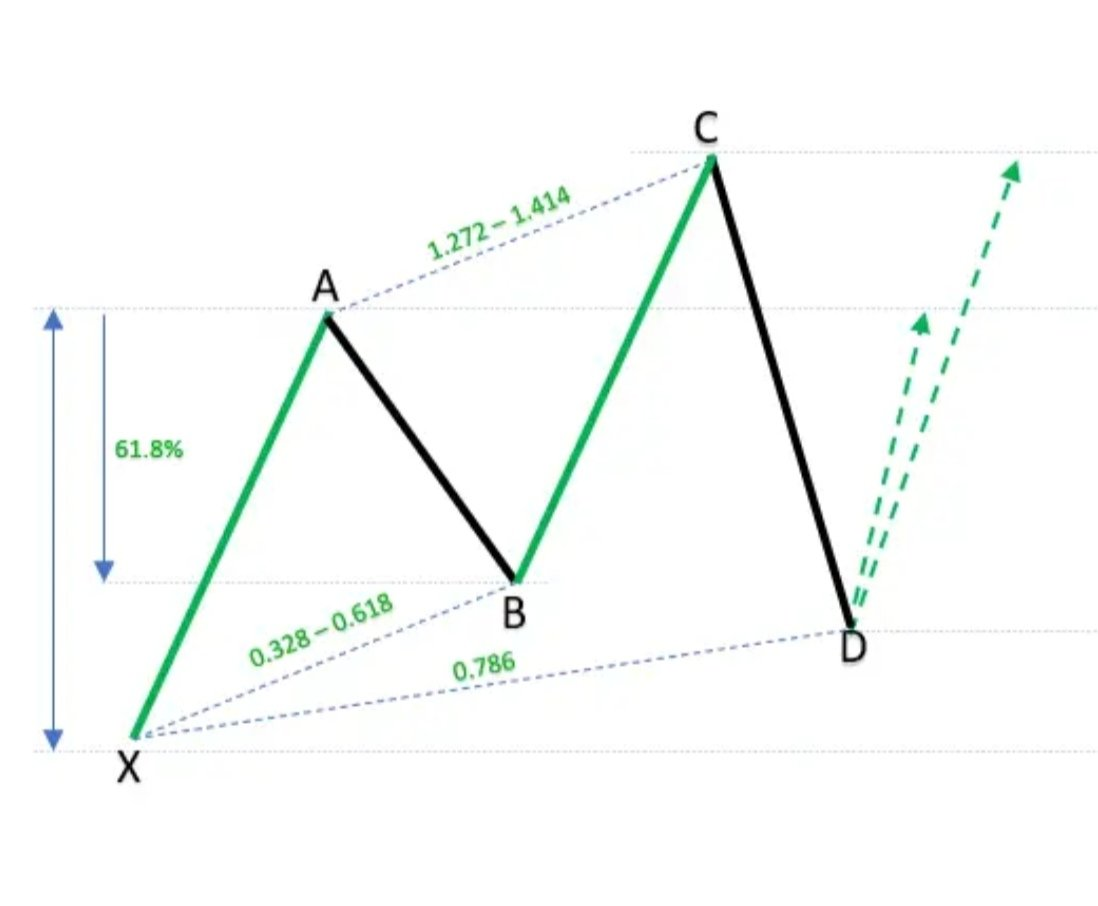
Technical analysis identifies the Cypher pattern as a harmonic formation that consists of four key legs: XA, AB, BC, and CD. In the present scenario, Bitcoin has followed the structure of this bullish pattern, with the CD leg still developing. The CD leg, often representing a final retracement before a reversal, is currently showing a steep downward movement.
Market Conditions and Potential Impact
Bitcoin’s movement within the CD leg has raised concerns among traders, as steep declines can indicate strong bearish momentum. However, if the Cypher pattern completes its formation, traders may look for price stabilization around the D point, historically seen as a potential support level.
The Cypher pattern is known for its retracement levels, typically seeing the CD leg extend beyond the 1.272 Fibonacci level of the BC leg. If Bitcoin adheres to this structure, the price may continue to decline before reaching a potential reversal zone at the D point, which is often positioned near the 0.786 Fibonacci retracement of the entire XA move.
Focus on Fibonacci levels is crucial, particularly the 0.786 retracement zone of the XA leg. If price action confirms the pattern’s completion, the ongoing downtrend within the CD leg will remain a critical phase in the structure.