
- XLM looks to be finding $0.294 resistance, and if broken, could push the price up toward the descending blue trendline above.
- Trading in derivatives has remained active on major exchanges, and recent trading volume has been lower than previous peaks. .
- The weekly structure shows converging trendlines, leaving the next sustained breakout or rejection increasingly important for market direction.
XLM’s weekly chart has been tightening, and the price is closing in on an important resistance area, but the volume is dropping, casting a spotlight on traders to seek solid confirmation before the close.
$0.294 Remains the Key Technical Barrier
More Crypto Online identifies $0.294 as the next key resistance level. A weekly break above that threshold would improve the technical outlook. Attention could then shift toward the descending blue trendline above.
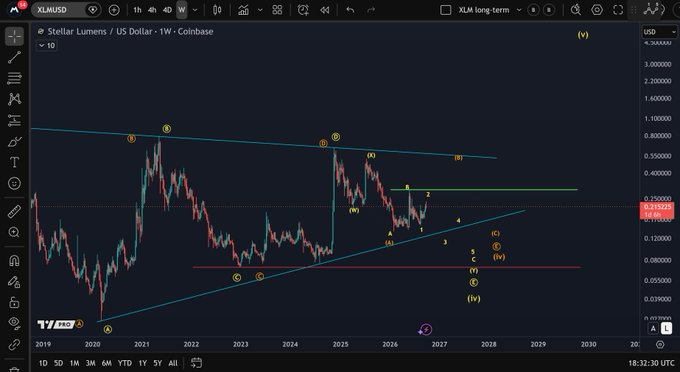
The weekly chart shows several expansion and correction phases across recent years.After the 2021 rally, XLM entered a deep bear market trend. A wider recovery emerged later, in 2023 and 2024.
That recovery has since encountered multiple resistance areas on the weekly chart. The green horizontal line marks another barrier above the current resistance. Therefore, a breakout would still face additional technical levels overhead.
The market data as of writing places XLM price at $0.2151, according to coingecko. That leaves XLM below the $0.294 resistance identified by More Crypto Online. The distance between both levels keeps resistance central to the present setup.
Volume History Shows Repeated Market Expansion
The volume chart records several periods of unusually strong market activity. The largest expansion appeared around November 19 during a sharp price advance. Daily volume approached $10 billion as XLM moved above $0.50.
That rally eventually reversed after reaching the 0.50–0.55 region. Price then entered an extended decline through December and January. Several smaller volume increases appeared during that broader corrective period.

Another large volume spike emerged around late July on the chart. Trading activity again reached several billion dollars during the price recovery. However, the subsequent decline showed that momentum could not remain sustained.
Recent volume has remained considerably lower than those earlier market surges. This creates a quieter backdrop around the current technical structure. A renewed volume expansion could accompany any confirmed move above resistance.
Derivatives Activity Keeps Market Positioning Active
The derivatives data shows substantial open interest across several major exchanges. Binance leads with approximately $54.94 million in XLM open interest. Bybit follows at $46.64 million, while MEXC records $45.72 million.
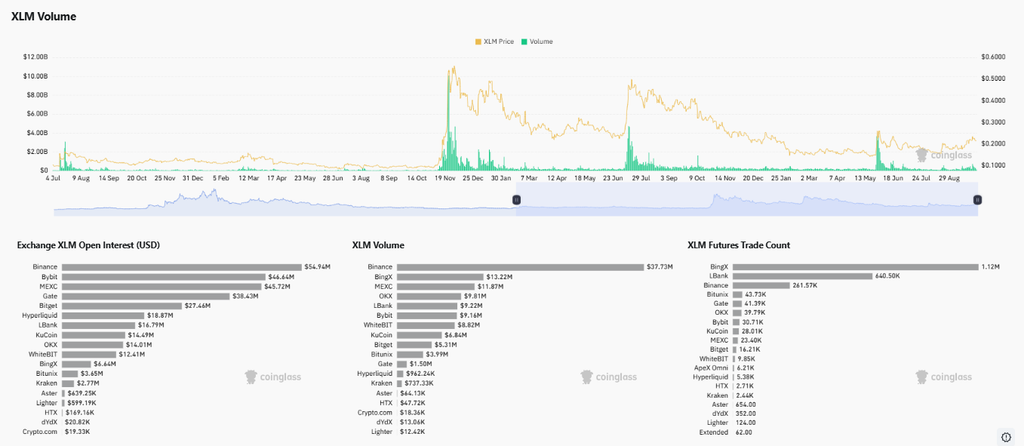
Gate holds approximately $38.43 million, with Bitget following at $27.46 million. These figures show continued derivatives participation despite reduced recent trading volume. The positioning also adds context to potential short-term volatility around resistance.
Binance records approximately $37.73 million in XLM volume on the displayed data. BingX follows with $13.22 million, while MEXC reaches $11.87 million. OKX and LBank also register notable volumes across the displayed exchanges.
BingX leads the futures trade count with approximately 1.12 million transactions. LBank follows with about 640,500 trades, while Binance records 261,570. For now, the $0.294 level remains central to the weekly technical structure.