
- The Dogecoin price is still in a corrective pattern, and the 0.0833-0.0900 range is a significant bull market area.
- The current recovery appears without a definite upward momentum, and crossovers of price action continue to watch the potential diagonal formation.
- Fibonacci references near $0.1188, $0.1304, $0.1380, and $0.1516 mark potential upside areas if momentum strengthens.
The Dogecoin price outlook is corrective, with key support levels being defended and the market waiting for increased direction before moving forward.
Dogecoin Recovery Remains Corrective
Dogecoin is trading near $0.09469, down 1.88% over 24 hours. The first significant reference is found around $0.1188. That pullback has kept the broader recovery under pressure.
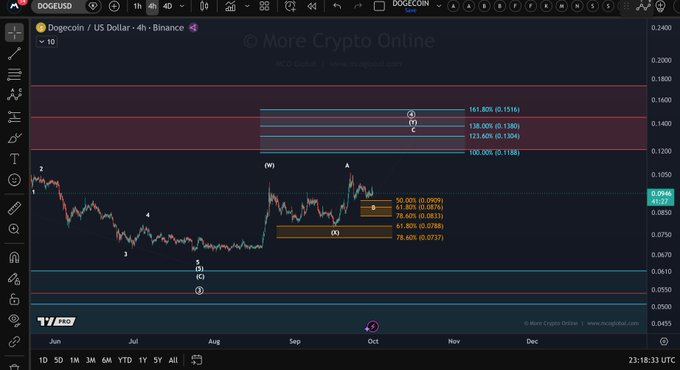
The four-hour chart shows a sharp recovery from the August low near $0.0600. Buyers subsequently pushed prices above the $0.1000 region. However, the advance has not developed into a clear impulsive structure.
Instead, recent movements contain several overlapping swings and corrective sequences. This structure has limited evidence of sustained directional buying. Price continues moving within a developing recovery pattern.
More Crypto Online noted that no upside impulse was visible on the chart. The analysis also identified a possible diagonal pattern under the constructive scenario. That interpretation remains dependent on how price behaves around nearby support.
0.0833-0.0900 Zone Remains Important
The 0.0833-0.0900 region remains central to the current technical structure. More Crypto Online identified this area as important for maintaining higher prices. Holding above it keeps the stated short-term recovery scenario intact.

The lower boundary becomes more relevant during periods of renewed selling. A sustained break beneath this zone could weaken the developing recovery. It could also shift attention toward lower levels from the preceding decline.
Meanwhile, the latest chart shows DOGE consolidating around the mid-$0.09 area. The price recently approached $0.0975 before reversing sharply. Subsequent trading returned toward approximately $0.0940 before a modest recovery.
The immediate $0.0940 area therefore provides another short-term reference. Holding above that level could support further consolidation. Reclaiming $0.0950 would provide an initial sign of improving intraday momentum.
Fibonacci Levels Define Potential Recovery Areas
The chart displays several Fibonacci extension levels above the current trading range. The first significant reference is found around $0.1188. Higher levels include approximately $0.1304, $0.1380, and $0.1516.
These levels become relevant only if DOGE develops stronger upward momentum. A move toward $0.1188 would require a sustained recovery above recent highs. The higher extensions would then become additional technical references.
It should be noted that the previous move was from approximately $0.0600 to approximately $0.1050. The price increase followed months of declining prices. However, subsequent consolidation has prevented confirmation of another sustained upward phase.
The current structure therefore remains dependent on support and directional confirmation. Holding the 0.0833-0.0900 zone preserves the constructive scenario described. A stronger impulse above recent highs would provide clearer evidence of renewed bullish momentum.