- XRP recovery has reclaimed the $1.50 area, while rising trendlines keep the latest daily structure constructive for now.
- MACD has turned upward again, while positive histogram bars show momentum improving after September selling pressure.
- The ascending channel points toward 1.60-1.70, while the lower trendline remains important for preserving the recovery structure.
XRP recovery has gained momentum after the token slipped below $1.50, with daily structure now showing higher lows inside an ascending channel.
XRP Reclaims The $1.50 Area
The Crypto Squire’s post draws attention to XRP’s sharp rebound after losing $1.50. The token subsequently returned toward the 1.55-1.59 range during the latest session. That move places the market back above an important short-term reference.
The chart shows a much broader recovery developing since August’s sharp reversal. XRP previously approached the $1.00 region before buyers drove a powerful advance. That move carried the token toward $1.70 before consolidation began.
September then brought a different trading structure, with XRP moving through several volatile sessions. Price repeatedly tested lower areas before recovering toward the $1.50 region. This sequence gradually produced higher lows across the latest portion of the chart.
As the price of XRP is fluctuating, it is as of writing trading on a $1.5488 price tag. The daily candle has an open at $1.5679 and a high in the neighborhood of $1.5803. Its low reached approximately $1.5458 before the latest reading.
Rising Channel Shapes The Current Structure
Two ascending trendlines now contain much of XRP’s recent price movement. The lower trendline has started from the September low and is heading towards the upper candles. Meanwhile, the top limit is heading towards the 1.60-1.70 area.
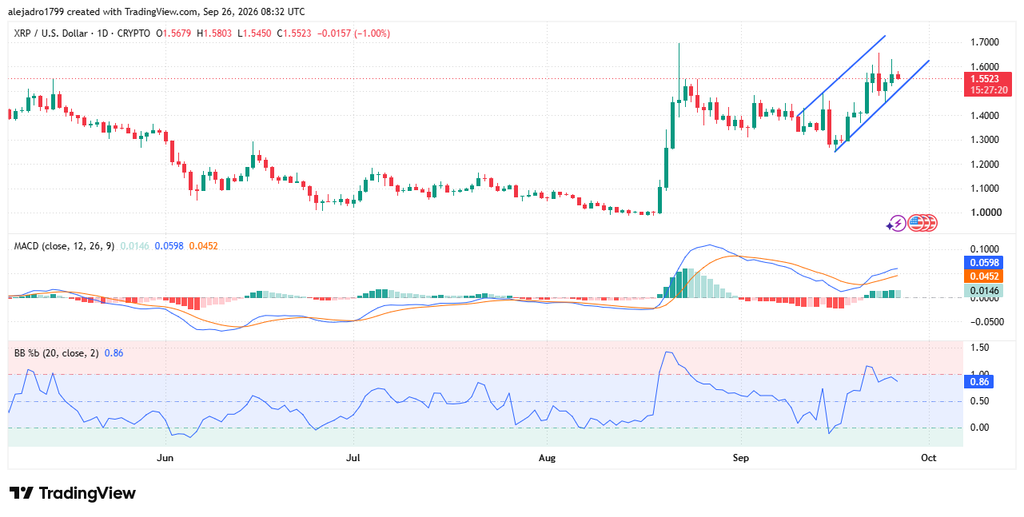
This structure places the market between dynamic support and overhead resistance. A continued climb would keep price moving within the established channel. However, a break below the lower boundary would alter the current technical formation.

The $1.60 area stands above the latest price and near the channel’s upper section. Beyond that level, the previous August peak around $1.70 remains visible. These levels provide clear references as the market continues navigating its recovery.
The Crypto Squire described the latest movement as XRP “pushing back” after sellers drove price lower. That description matches the chart’s reversal from the lower September area. The recovery has therefore become the dominant feature of the latest price structure.
MACD Turns Higher As Momentum Recovers
The MACD indicator has also shifted upward following September weakness. The blue MACD line has moved above the orange signal line on the latest readings. Meanwhile, the histogram has returned to positive territory.
Green histogram bars now appear on the right side of the indicator panel. Their presence indicates improving momentum compared with the preceding negative readings. However, the expansion remains smaller than the powerful surge recorded during August.
The Bollinger Band reading has similarly recovered from its September trough. The latest reading sits around 0.86, placing the indicator toward the upper portion. That movement corresponds with XRP’s return toward the higher part of its recent range.
The technical picture therefore combines higher lows with improving momentum. The $1.50 region remains a key reference beneath the latest price. Above, $1.60 and the upper channel boundary provide the next visible areas of interest.