- XRP Trendline continues attracting attention as traders compare current structure with previous accumulation cycles.
- Historical support retests remain central as market participants monitor breakout confirmation.
- Technical resistance and momentum indicators continue shaping XRP’s short-term market outlook.
XRP Trendline remains the primary focus as traders compare historical cycle patterns with the current market structure. Technical indicators continue pointing toward an important decision point for the asset.
XRP Historical Pattern Draws Fresh Market Attention
Crypto Lens shared a follow-up market update comparing XRP with previous bull cycles. The analysis suggests XRP is respecting the same long-term trendline observed during 2017.
The chart outlines repeated creation points followed by three successful support retests. According to the analysis, every completed retest strengthened the broader accumulation structure.
Unlike short-term momentum trading, the framework emphasizes long-term market behavior. The recurring support line serves as the primary reference throughout each projected cycle.
Crypto Lens divides the projected advance into three separate phases. The roadmap extends from August through February using historical market behavior as guidance.
Short-Term Structure Still Faces Technical Resistance
Despite the optimistic long-term roadmap, XRP continues trading beneath descending resistance. The four-hour chart still reflects lower highs and lower lows across recent sessions.
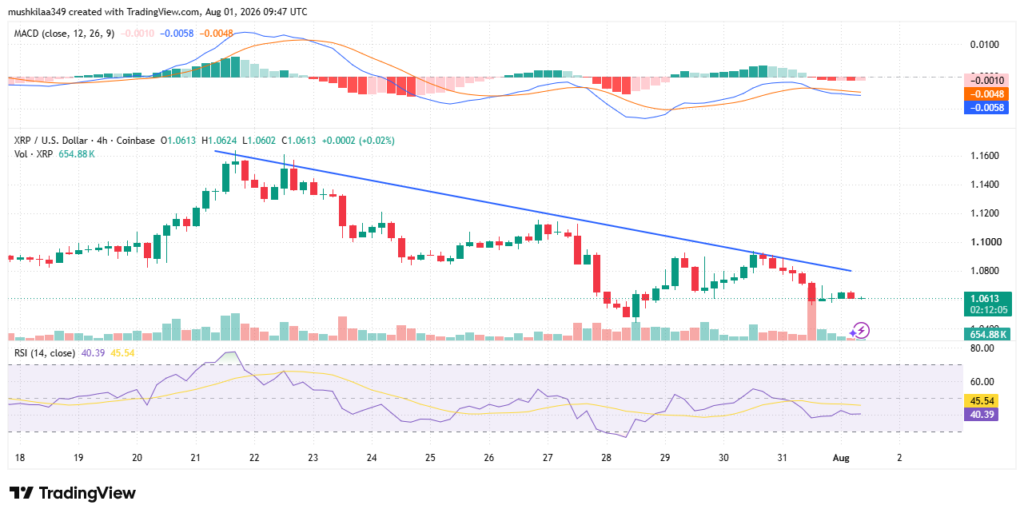
Price currently trades near $1.0610, following weakness from the recent $1.15 swing high. The $1.05-$1.06 support zone has seen buyers defend the levels on multiple occasions in recent price declines.

The $1.08 level is the first area of resistance that is expected to be encountered, followed by the $1.10-$1.12 area. These levels would significantly enhance short term market structure.
The MACD indicators show that the MACD signal line is being crossed and that the bearish histogram bars have been made smaller, while the MACD line is still in the negative position. The signal points to the down side are losing momentum but not to the bulls.
Support Levels Remain Central to XRP Outlook
The Relative Strength Index currently trades near 40, remaining below neutral territory. That reading indicates sellers still maintain a modest short-term advantage.
Crypto Lens expects the third historical retest to hold before expansion begins. The projection assumes, however, that the structural support will be maintained over the next few months.
The roadmap calls for a move back to $1.10 first, then a retracement to $0.97. The next potential levels are at $1.80, $2.70, $3.20, $6.50 and finally, $13.00 if the expected cycle is to be repeated.
Technical conditions are still more conservative than long-term technical conditions. A decisive break above descending resistance would provide stronger confirmation, while losing $1.05 support could reinforce the prevailing corrective structure.