
- Bitcoin ETFs saw a net outflow of $91.37 million while Ethereum ETFs reported a net inflow of $82.37 million in new funds.
- The recent trading of capital suggests a capital rotation in crypto circles rather than a significant institutional exit.
- Momentum indicators show improving Bitcoin market strength despite weaker ETF accumulation trends recently.
Bitcoin ETF Flows on June 8 revealed a clear split in the net inflow and outflow of institutional investors in the U.S. spot Bitcoin ETFs compared to Ethereum ETFs, indicating that institutional inflows and outflows are shifting.
Bitcoin ETF Outflows Contrast With Ethereum Demand
According to a tweet shared by Wu Blockchain, SoSoValue data showed Bitcoin ETFs recorded a $91.37 million net outflow. During the same session, Ethereum ETFs registered an $82.37 million net inflow. The figures revealed contrasting investor behavior across major digital assets.
The ETF flow chart displayed increasing red bars for Bitcoin. Those bars represented daily net outflows from spot Bitcoin funds. Earlier periods showed stronger accumulation through consistent green inflow readings.
Bitcoin continues to be the biggest institutional cryptocurrency investment vehicle. But recent withdrawals indicate that investors became more warped. After a long period of a rising price, traders could be re-evaluating their exposure to the market.
In the meantime, more institutional money flowed into Ethereum. The overall market volatility was not dampening the positive trend of the flow. Investors appeared willing to maintain exposure within digital asset markets.
Capital Rotation Emerges Across Crypto Investment Products
The near balance between Bitcoin outflows and Ethereum inflows was notable. Combined figures suggested money was shifting between assets. Capital did not appear to be leaving crypto investment products entirely.
Ethereum’s ETF strength has drawn attention among market observers. Investors continue monitoring ecosystem development and network activity. These factors remain central to Ethereum’s institutional investment case.

The chart also showed weakening ETF momentum compared with earlier months. Strong green inflow periods previously supported Bitcoin’s climb toward higher levels. Recent activity reflected less aggressive accumulation.
For market participants, ETF flows remain an important sentiment gauge. Persistent inflows often support stronger market participation. Repeated outflows can signal reduced conviction during uncertain conditions.
Price Trends and Momentum Indicators Tell Different Stories
A one-month comparison chart showed weakness across both assets. Bitcoin declined roughly 22.4% during the period. Ethereum experienced a steeper correction approaching 30%.
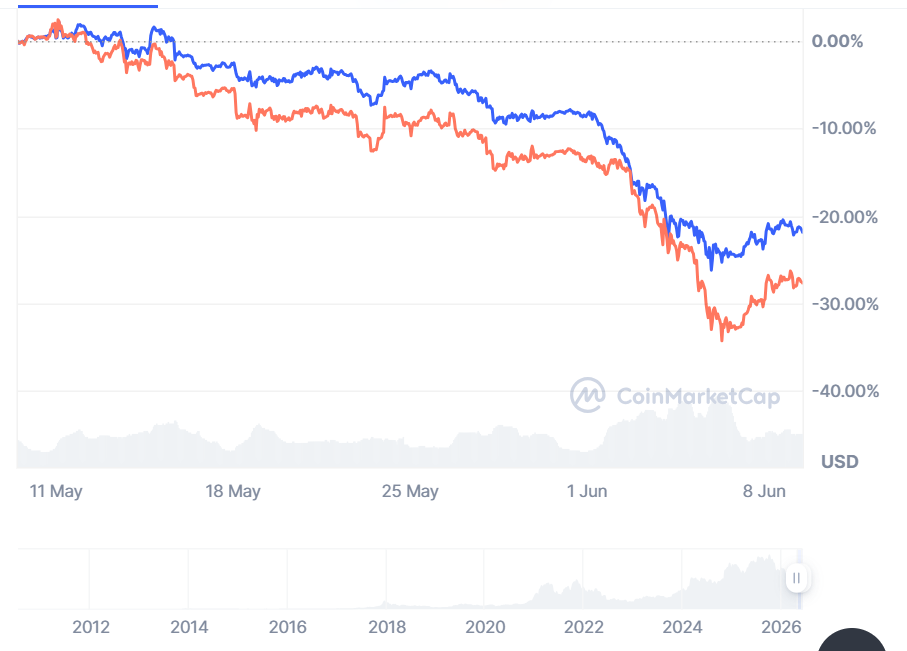
Bitcoin demonstrated relative strength despite the broader decline. The asset maintained smaller percentage losses than Ethereum. This pattern suggested investors favored Bitcoin during risk-off conditions.
Another chart combined Bitcoin price action with a momentum histogram. Green bars reflected positive momentum while red bars indicated weakness. The indicator shifted positive before Bitcoin’s major rally toward $120,000.
More recently, green readings have returned despite subdued prices. Bitcoin traded around the upper-$70,000 region in the chart analysis. Improving momentum suggested strengthening market participation, though price confirmation remains necessary.
