- A whale’s $6.6M AI token buy hints at renewed investor interest, sparking speculation of a potential rally in AI-related assets.
- AI tokens often follow broader crypto cycles—past whale activity preceded rallies, but traders should remain cautious of market shifts.
- Solana’s key $180-$200 support zone is under watch; holding it could spark a rebound, but a breakdown may signal further downside.
A mysterious whale has sparked fresh interest in AI tokens. Within two hours, the whale spent 17,250 SOL ($3.53M) to acquire 11.11 million ARC at $0.32. Additionally, they spent 15,000 SOL ($3.07M) to secure 5.48 million AI16Z at $0.56. This investment hints at a possible resurgence in AI-related cryptocurrencies. Consequently, traders are closely watching these assets for potential upward movements.
AI Tokens Witness Renewed Interest
AI-based tokens have seen renewed traction in the market. Buy orders indicate growing confidence in their long-term value. Moreover, institutional and whale activity often signal potential market shifts. When major players accumulate assets, it typically leads to increased interest among retail traders.
Besides, past trends have shown that AI tokens follow broader crypto market cycles. In late 2023, similar whale activity preceded a strong rally in AI-related projects. If history repeats itself, AI tokens may experience another breakout in the coming months. However, traders must remain cautious and watch market sentiment closely.

Solana Holds Critical Support Levels
Solana’s price action remains a focal point for investors. It initially saw a strong breakout in late 2024, reaching a peak above $260. However, a sharp decline followed, with SOL retracing much of its gains. Currently, it hovers near a key support zone between $180 and $200.
This level holds historical significance. It previously acted as resistance before flipping into support. If SOL maintains this zone, a potential rebound could occur. However, fully retracing the January pump signals underlying weakness in the market. The weekly chart indicates a heavy structure, suggesting that recovery may take time.
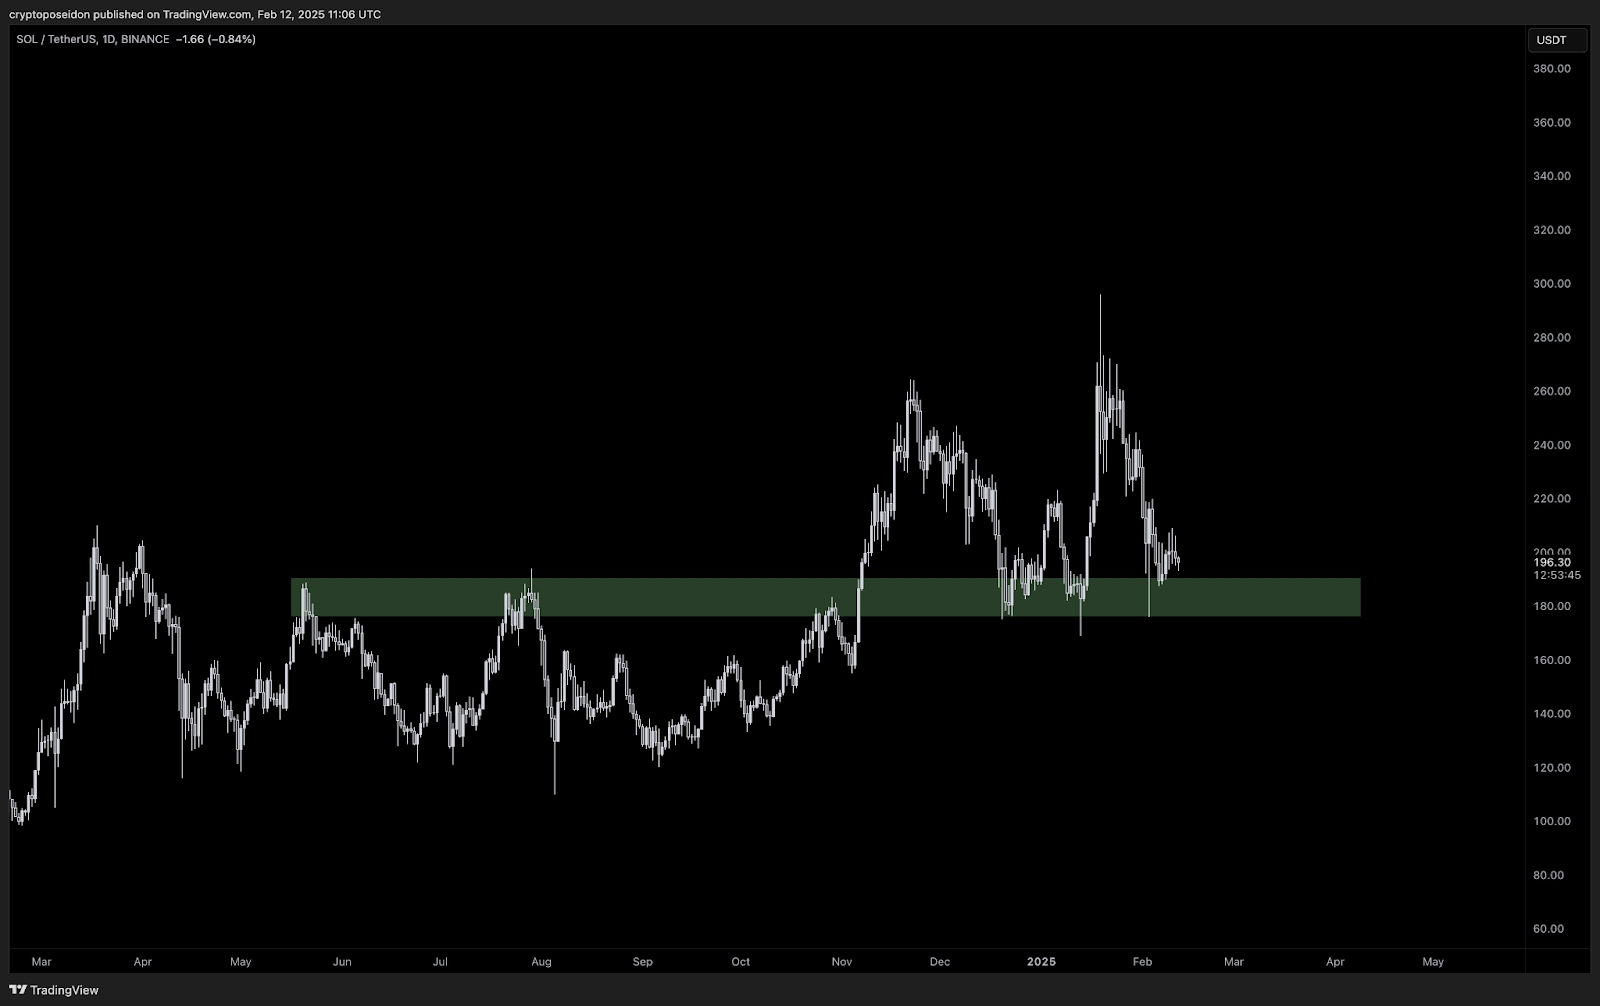
Source: Poseidon
Additionally, price volatility remains high. Multiple wicks on the chart indicate liquidity grabs and rejections at key levels. Consequently, traders should exercise caution when making decisions. A clean bounce from this support zone could signal renewed bullish momentum. Conversely, a breakdown may trigger further downside pressure.
