- The crypto market mirrors past cycles, hinting at a double bottom pattern that could take until mid-2026 to fully play out.
- Support and resistance levels shape market trends, with past patterns suggesting a breakout attempt after a steady recovery.
- Three scenarios emerge: a false pattern, an imminent breakout, or a supercycle extending bullish momentum.
The cryptocurrency market is exhibiting signs of repeating a significant pattern seen in previous cycles. A recent analysis by CryptoBullet highlights a potential double bottom formation on the OTHERS.D 1W chart. This structure resembles the 2019–2020 accumulation phase for altcoins, raising expectations for a possible breakout.
The current market dip aligns with the COVID crash pattern observed in the past. If the pattern remains consistent, the market could take between one to one and a half years to play out. Consequently, this suggests a full cycle could extend throughout 2025 and the first half of 2026.
Comparing Market Cycles
The provided charts compare the 2018–2021 and 2022–2026 periods, emphasizing market dominance excluding the top ten assets. The charts reveal a rectangular range where price movements fluctuate between defined support and resistance levels.
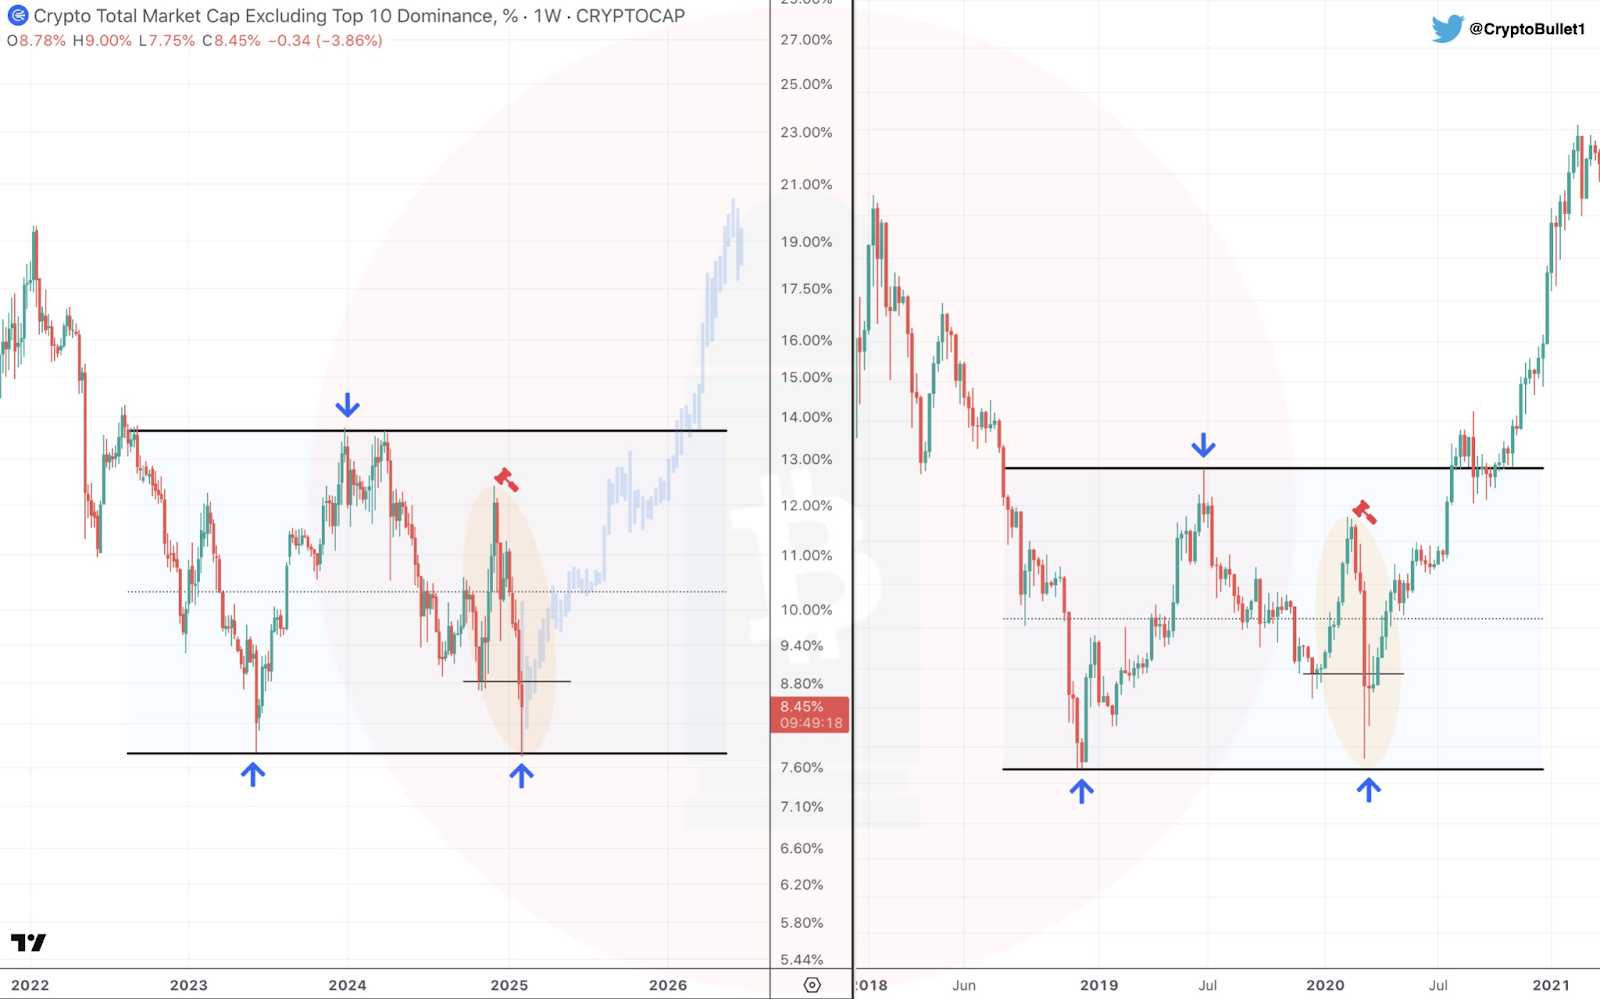
Source: CryptoBullet
Notably, the support level, marked by blue arrows, indicates areas where prices rebounded after a decline. Conversely, the resistance level, marked by blue downward arrows, highlights rejection points where prices failed to break higher. A red arrow shows an unsuccessful breakout attempt, followed by a sharp drop.

In both charts, the market initially faced rejection at resistance before dropping toward support. However, it rebounded, forming a structure of higher lows and higher highs. This trend suggests the market could experience another breakout attempt after maintaining a steady recovery.
Potential Market Outlook
The shaded region in both charts marks a rapid drop followed by a swift recovery. This pattern indicates a temporary setback before resuming an upward trajectory. Moreover, the mid-level breakout in the previous cycle led to a significant rally.
If the current cycle mirrors past trends, dominance levels may increase once resistance is breached. Besides, the recurring price structure suggests that historical cycles are playing out once again.
CryptoBullet’s analysis presents three possible outcomes. First, the market could be following a false pattern. Second, a breakout might occur soon, given the limited time left. Lastly, the market could be in a supercycle, meaning prolonged bullish momentum.
