
- AI16Z rebounds near $1.00 USDT, forming a double-bottom pattern; key resistance at $2.00 and $2.50 may trigger bullish momentum.
- Fibonacci levels at $0.793 and $1.316 hold as pivotal zones, with support signaling potential recovery amid market volatility.
- A breakout above $1.316 USDT could validate bullish momentum, with historical peaks hinting at upside potential toward $2.60.
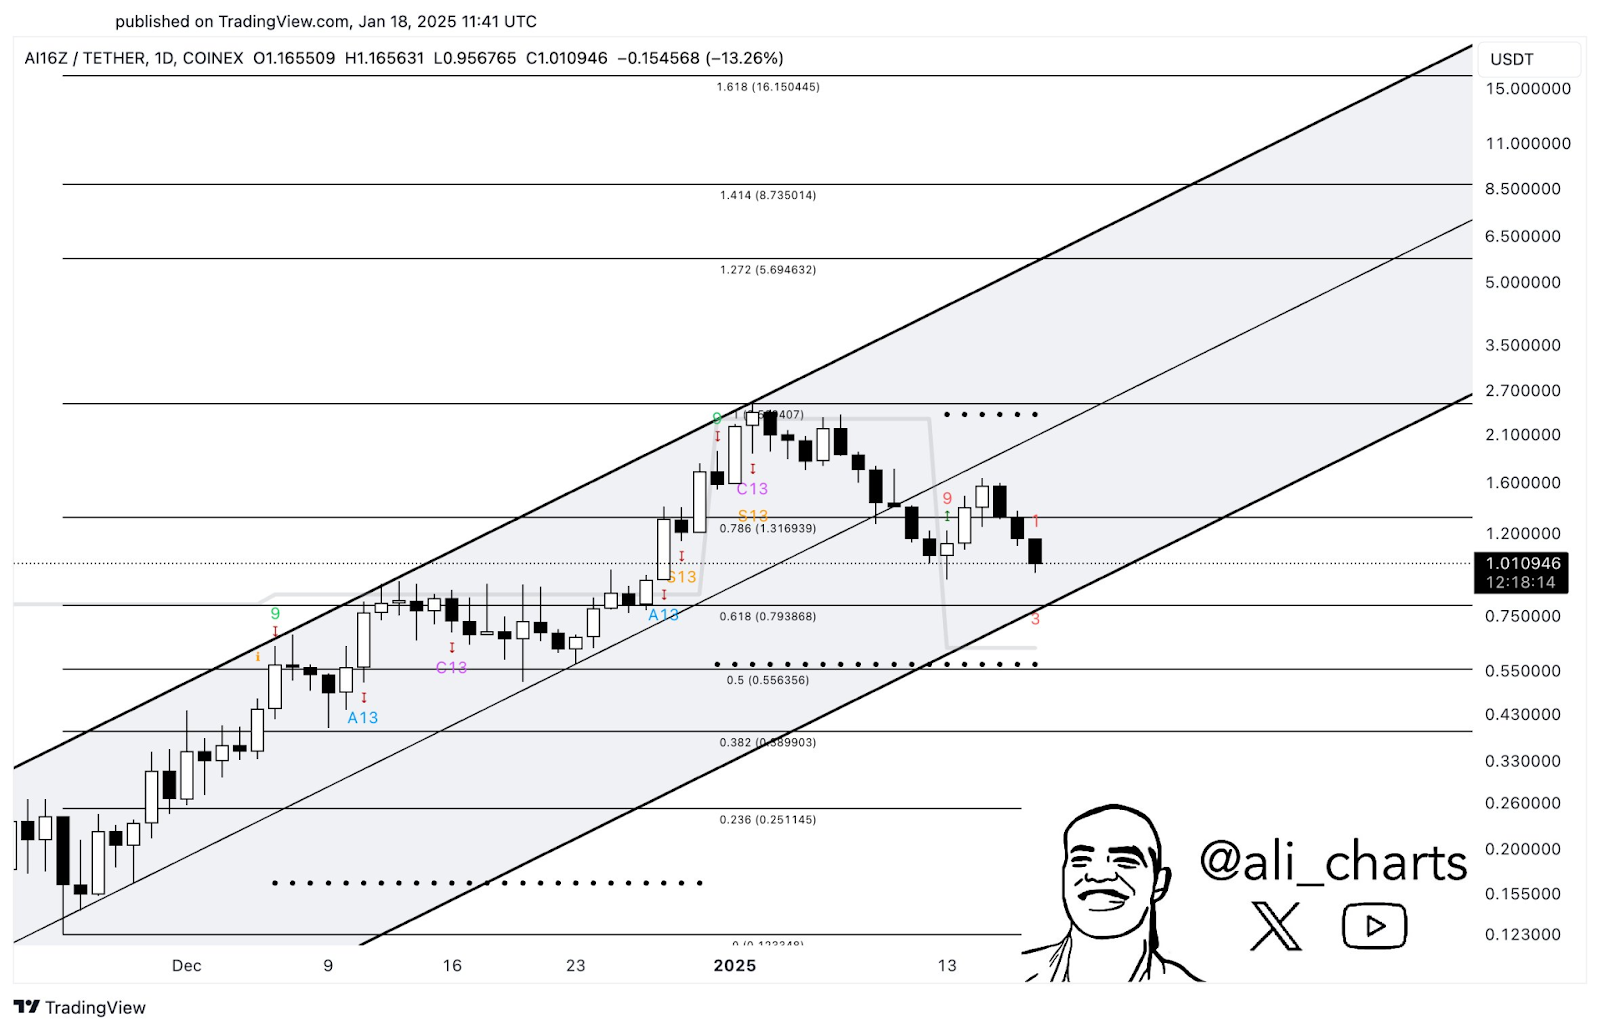
AI16Z, a trending cryptocurrency, experienced heightened volatility, with prices dipping to $1.010946 USDT after a 13.26% decline on January 18, 2025. The asset remains within a clear uptrend channel supported by Fibonacci retracement levels, despite the recent bearish movement. Analysts highlight support near $0.80 and a potential rebound toward $2.60.
Downtrend Signals and Critical Levels
The price exhibited a series of lower highs and lower lows, reflecting a short-term bearish structure. Candlestick patterns showed selling pressure, with the asset closing below its intraday high of $1.165509 USDT. However, it held key support at the 0.618 Fibonacci level, around $0.793868 USDT, signaling the potential for recovery.
Source: Ali
Besides, historical data points to a pivotal resistance zone near the 0.786 Fibonacci level at $1.316893 USDT. A decisive breakout above this level could validate bullish momentum. Notably, the price has retraced from its historical peak near $16.15, underscoring the need for strong support to fuel a reversal.
Reversal Hints and Momentum Shift
The asset displayed resilience with consolidation around $1.00 USDT, forming a rectangular support zone. This zone hosted a potential double-bottom pattern, marked by troughs on January 13 and subsequent days. Between these lows, an upward correction reached $1.50 USDT, hinting at a pause in bearish pressure.

Consequently, bullish candles emerged, breaking the immediate resistance at $1.1755 USDT. This upward movement suggests renewed buyer interest, particularly as volume increases. Besides, key resistance levels at $2.00 and $2.50 USDT remain critical targets for a sustained bullish breakout.
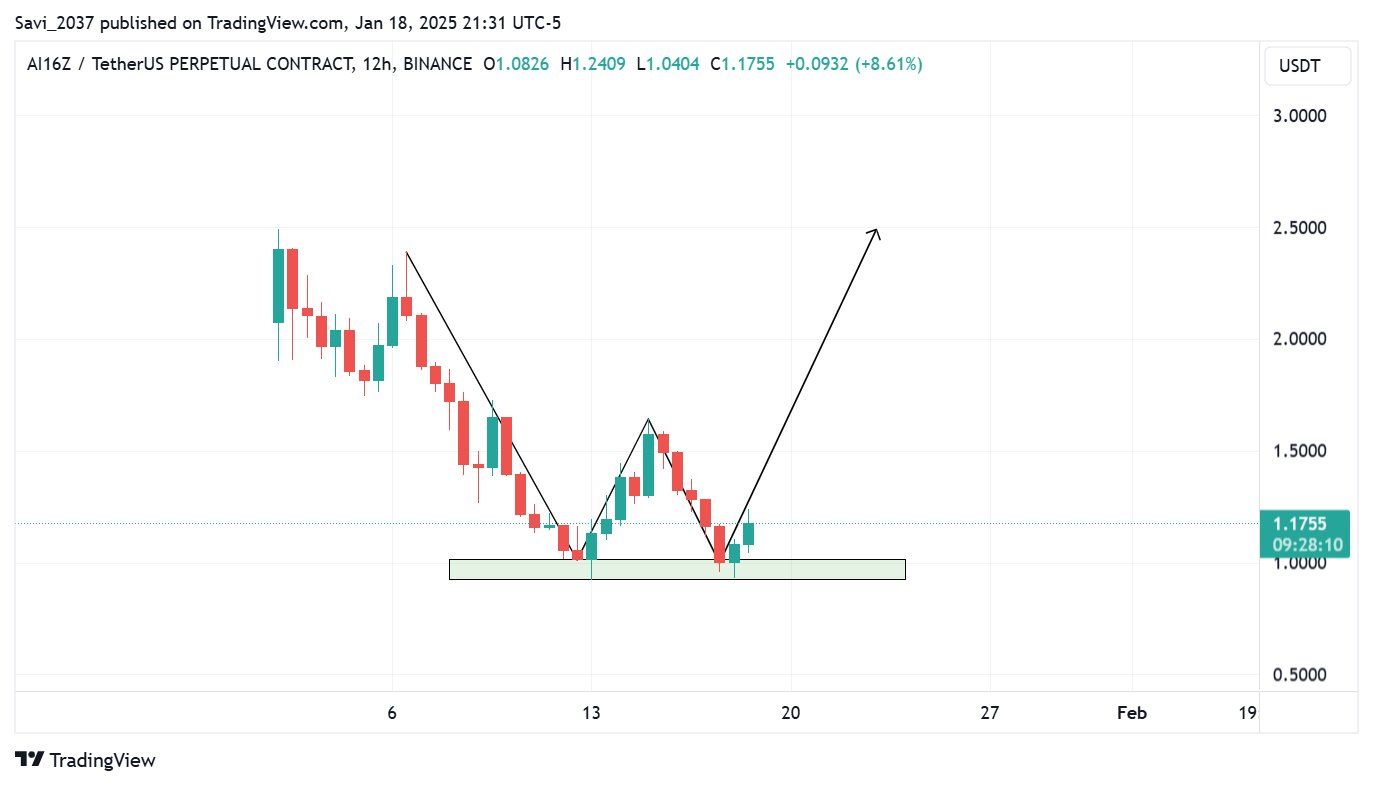
Source: Crypto Tigers
Outlook and Market Sentiment
The market’s current structure reflects an accumulation phase within a broader uptrend. Fibonacci levels between $0.556 and $0.793 coincide with a prior consolidation zone. These levels are likely to attract substantial buying interest if tested again.
Moreover, bullish momentum gained traction as the final candle of the session rose by 8.61%. This reflects optimism among traders expecting a reversal. However, price volatility demands close observation of key support and resistance zones.
