
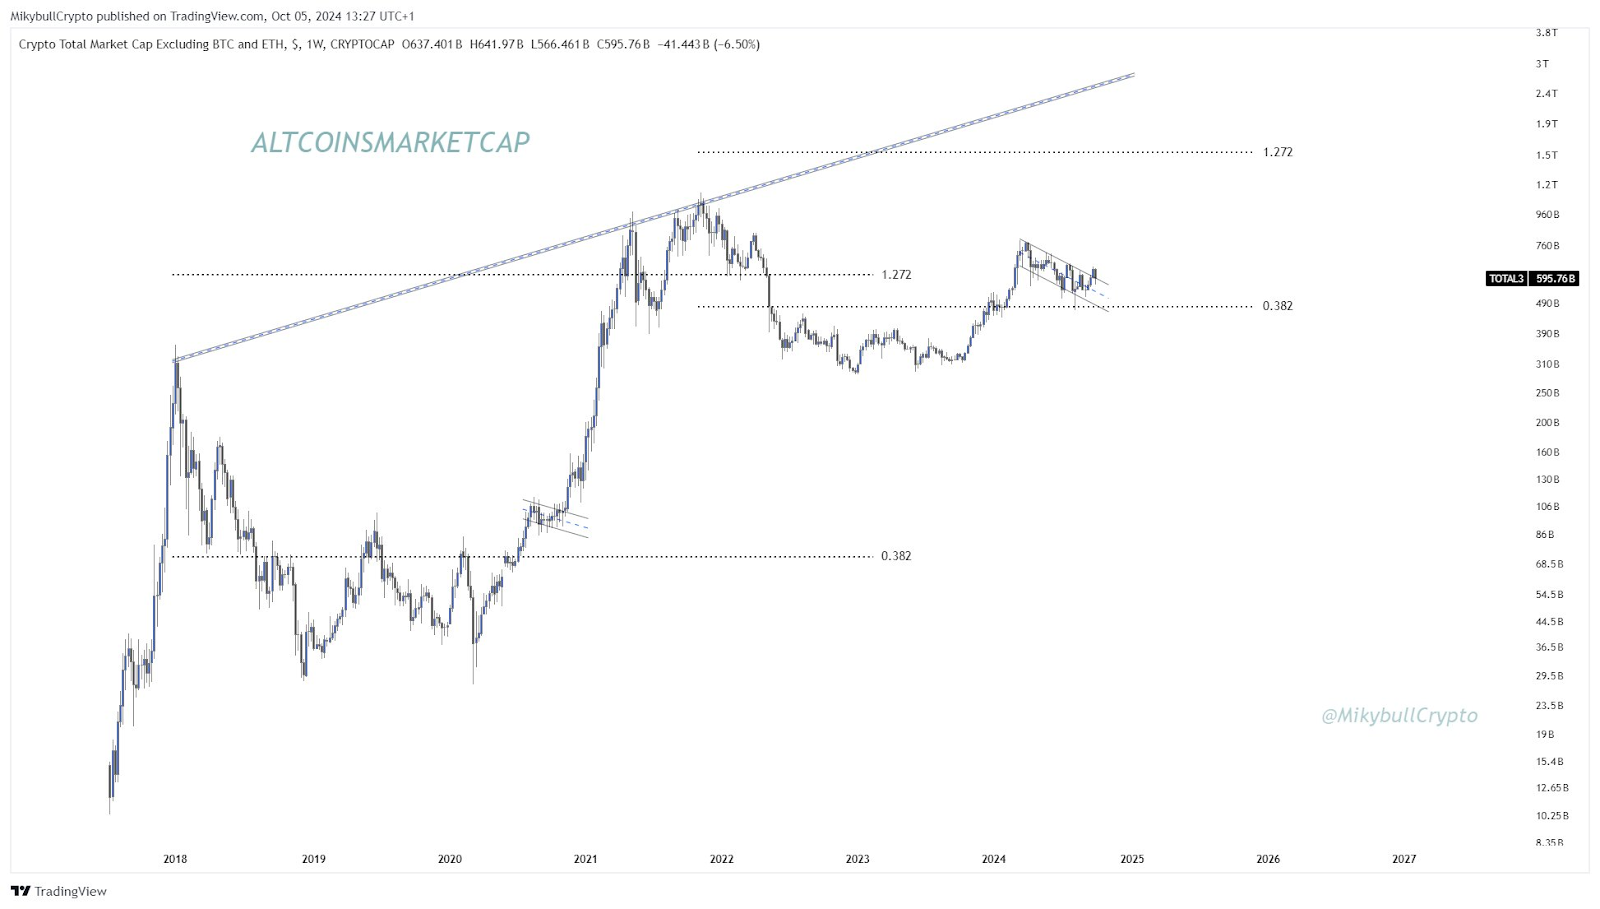
- Altcoin market cap faces critical test at 0.382 Fibonacci support, risking further decline if levels break.
- Analyst warns of market weakness as a long-term bullish trendline dating back to 2017 breaks, suggesting downside risk.
- Altcoin market shows a descending triangle pattern, hinting at potential continuation of bearish movement or a bullish breakout.
According to MikybullCrypto, a crypto analyst on X, recently provided insights regarding the approaching altseason. According to his analysis, despite a recent market downturn, altcoins are in the midst of retesting the breakout channel. His forecast suggests that the market is at a pivotal moment, potentially up for a new rally if key support levels hold.
Market Overview and Fibonacci Levels
The total altcoin market cap, excluding Bitcoin and Ethereum, was valued at $595.76 billion. The market experienced a notable loss of 6.50% for the week. Importantly, the analyst highlighted two crucial levels: the 1.272 Fibonacci extension at $1.27 trillion and the 0.382 Fibonacci retracement at $382 billion.
 Source: MikybullCrypto
These Fibonacci levels serve as markers for traders. The extension level represents resistance, as the market retraced from this point after hitting it earlier, while the retracement acts as a key support zone. The market has touched both levels, showing that these areas may play a critical role in determining future price movements.
Trendline and Market Cycles
The analyst also emphasized a long-term trendline dating back to 2017. This upward trendline supported the market for years but was recently broken, indicating a potential shift in momentum.
The break suggests weakening bullish sentiment, which could result in more prolonged bearish or sideways movement. Historical patterns, including the bull runs of 2017-2018 and 2020-2021, further support this outlook.
Each cycle saw a dramatic increase in the altcoin market cap, followed by a sharp correction. Since the correction after the 2021 peak, the market has been consolidating, moving within a confined range.
Current Market Structure and Future Scenarios
The market is now forming a descending triangle, a pattern often seen before a continuation of downward trends. If the market breaches its current support levels, notably the 0.382 Fibonacci retracement, there is potential for a deeper decline, possibly testing the $250-310 billion range.
However, should the market break upwards from the descending triangle, it could attempt to regain the $1 trillion mark, with the 1.272 Fibonacci extension being the next target.