
- According to recent analysis, the price of bitcoin is declining.
- Technical indicators point to more bearishness.
- Bulls must hold on to the resistance level in order to reverse this trend.
Over the last day, the global crypto market has experienced a drop in performance. According to recent data, Bitcoin has been impacted by the downward trend. As the crypto market shifted, the price of Bitcoin fell over the last 24 hours, with bears dominating the BTC market. The market has seen an increase in BTC price in the last few hours, but bearish pressure has resulted in a change in BTC price.
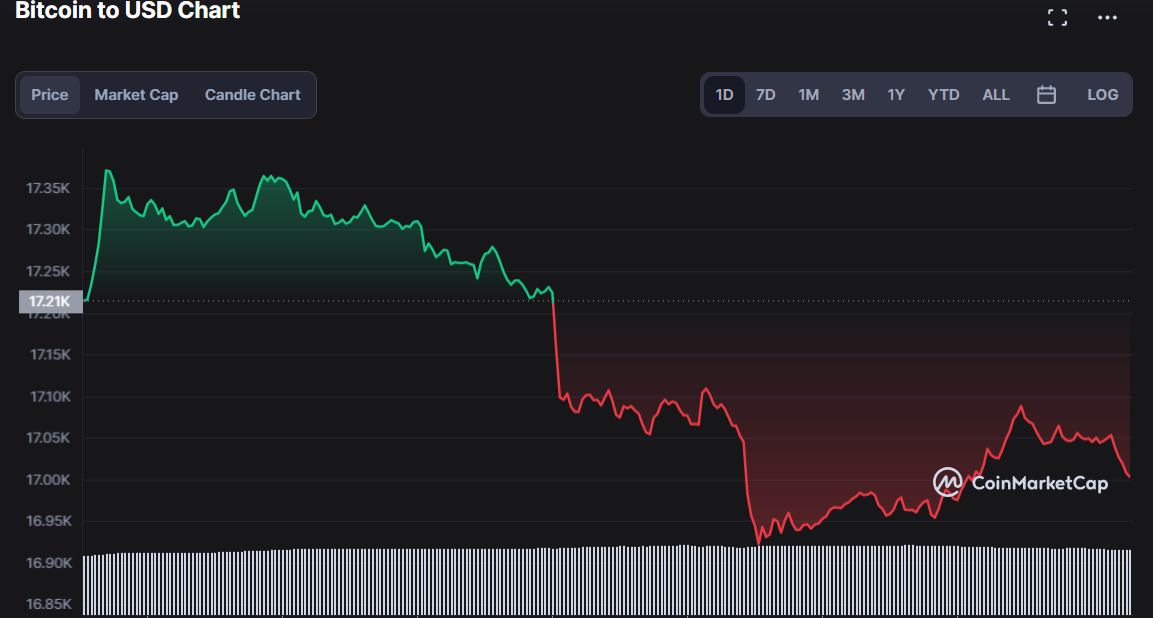
Today’s Bitcoin price analysis shows that the BTC price has fallen by 1.44%, with its support at $16,922.43 and resistance at $17,378.15. Bitcoin is currently trading at $17,002.70, with a 24-hour trading volume of $20,935,718,260.
Given the low market volatility, the convergence of the bollinger bands on the 4-hour price chart suggests that the BTC price may experience a protracted bear market. The fact that the upper band reads 17265.33 and the lower band reads 16798.21 makes this clear. In the short term, these readings represent the levels of immediate support and resistance.
Further bearish momentum is expected as the Moving Average Convergence Divergence (MACD) line moves below the signal line. This is clear from the MACD line’s 41.51 reading and the signal line’s 66.85 reading. This bearish trend on the BTC price chart is supported by the negative trajectory of the histogram, with a reading of -24.43.
With a reading of 21.95, the Average Directional Index (ADX) shows that Bitcoin is in a bearish trend and that the price may soon enter a period of consolidation.

Despite the fact that the Relative Strength Index (RSI) is at 50.68, bearish momentum is increasing as it moves below its simple moving average (SMA), which is at 57.31. Bullish momentum may be experienced if the bulls correct the trend on the price chart of the market.
Bears will remain in control of the market as Chainkin Money Flow (CMF) is negative with readings of -0.15 and is pointing to the south, indicating that their control might be prolonged.
The Elder Force Index (EFI) indicates that there are more sellers than buyers, with a reading of -2.341. This indicates that buyers are unwilling to meet the sellers’ demand.

To sum up, the Bitcoin (BTC) price is going down, and the technical indicators show that this market movement is likely to continue in the next few hours.
disclaimer read moreCrypto News Land, also abbreviated as "CNL", is an independent media entity - we are not affiliated with any company in the blockchain and cryptocurrency industry. We aim to provide fresh and relevant content that will help build up the crypto space since we believe in its potential to impact the world for the better. All of our news sources are credible and accurate as we know it, although we do not make any warranty as to the validity of their statements as well as their motive behind it. While we make sure to double-check the veracity of information from our sources, we do not make any assurances as to the timeliness and completeness of any information in our website as provided by our sources. Moreover, we disclaim any information on our website as investment or financial advice. We encourage all visitors to do your own research and consult with an expert in the relevant subject before making any investment or trading decision.